Barometer data

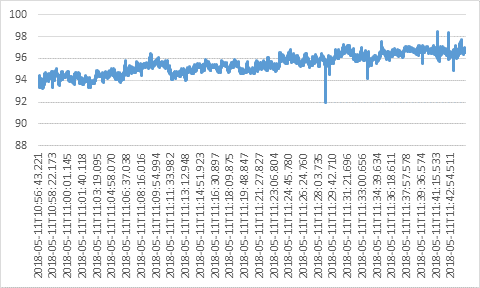
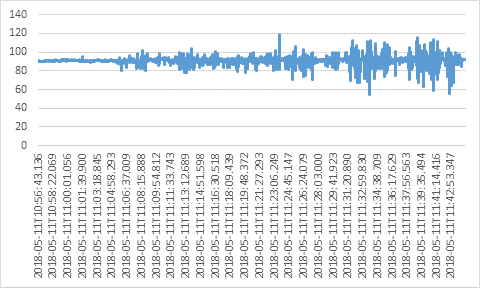
I have a question regarding barometer sensor in MetaMotion R device. We notice that barometer recordings often exibit a continous trend. Moreover, in the same situation some devices produce such trend, while other don't. Below is an example of simultaneous recording
with two devices (one was positioned on a person's right wrist, another one - on the left wrist). We would like to know what may cause such behaviour.
This discussion has been closed.
Comments
What exactly are those graphs representing and what is your current issue? They do not have the same y-axis nor any units so I can't really discern anything at a quick glance.
Please provide the raw barometer data as well.
The graphs show the altimeter data (y-axis -- altimeter values, x-axis -- timestamp) received from two devices MetaMotion R at the same time.
Data for the first graph (with trend) https://drive.google.com/open?id=1m0P_2FmMH0eHUid7ceNjUWYgLhTUJcbC
Data for the second graph (without trend) https://drive.google.com/open?id=1bOKWwx6L3LhNdNSHdkCRhhzJ7S4pJoEQ
Issue is why at the same time one device shows the trend in altimeter values while another not.
Please describe the trend you are seeing. Simply stating that one data set exhibits a "trend" and the other doesn't does not provide a useful description of your problem.
Again, your graphs are very misleading as the y-axis are not the same. The raw data does not suggest anything is wrong but there are ~61000 entries so I'm not sure which entries I should be looking at.
A quick glance as the files doesn't show anything abnormal. They both finish with values higher than the initial values and both differences are by approximately +3 so it looks like both sensors are exhibiting the same behavior.
Thank you, we have found that both data sets have the same trend