Sync Sensor Data
There are many possible topologies for Bluetooth based sensor systems
Synchronizing Multiple Datasets in Excel
When collecting data from multiple sensors or multiple devices, you may want to synchronize the data to a single set of time stamps. We can accomplish this in Excel in a few seconds.
In our test, we use two MetaSensors streaming accelerometer data.
We used two sensors, therefore we get two files; Calib3_Accelerometer_2017-09-14T13-39-02.461.csv and Calib4_Accelerometer_2017-09-14T13-39-02.461.csv.
We graphed the data in Excel:
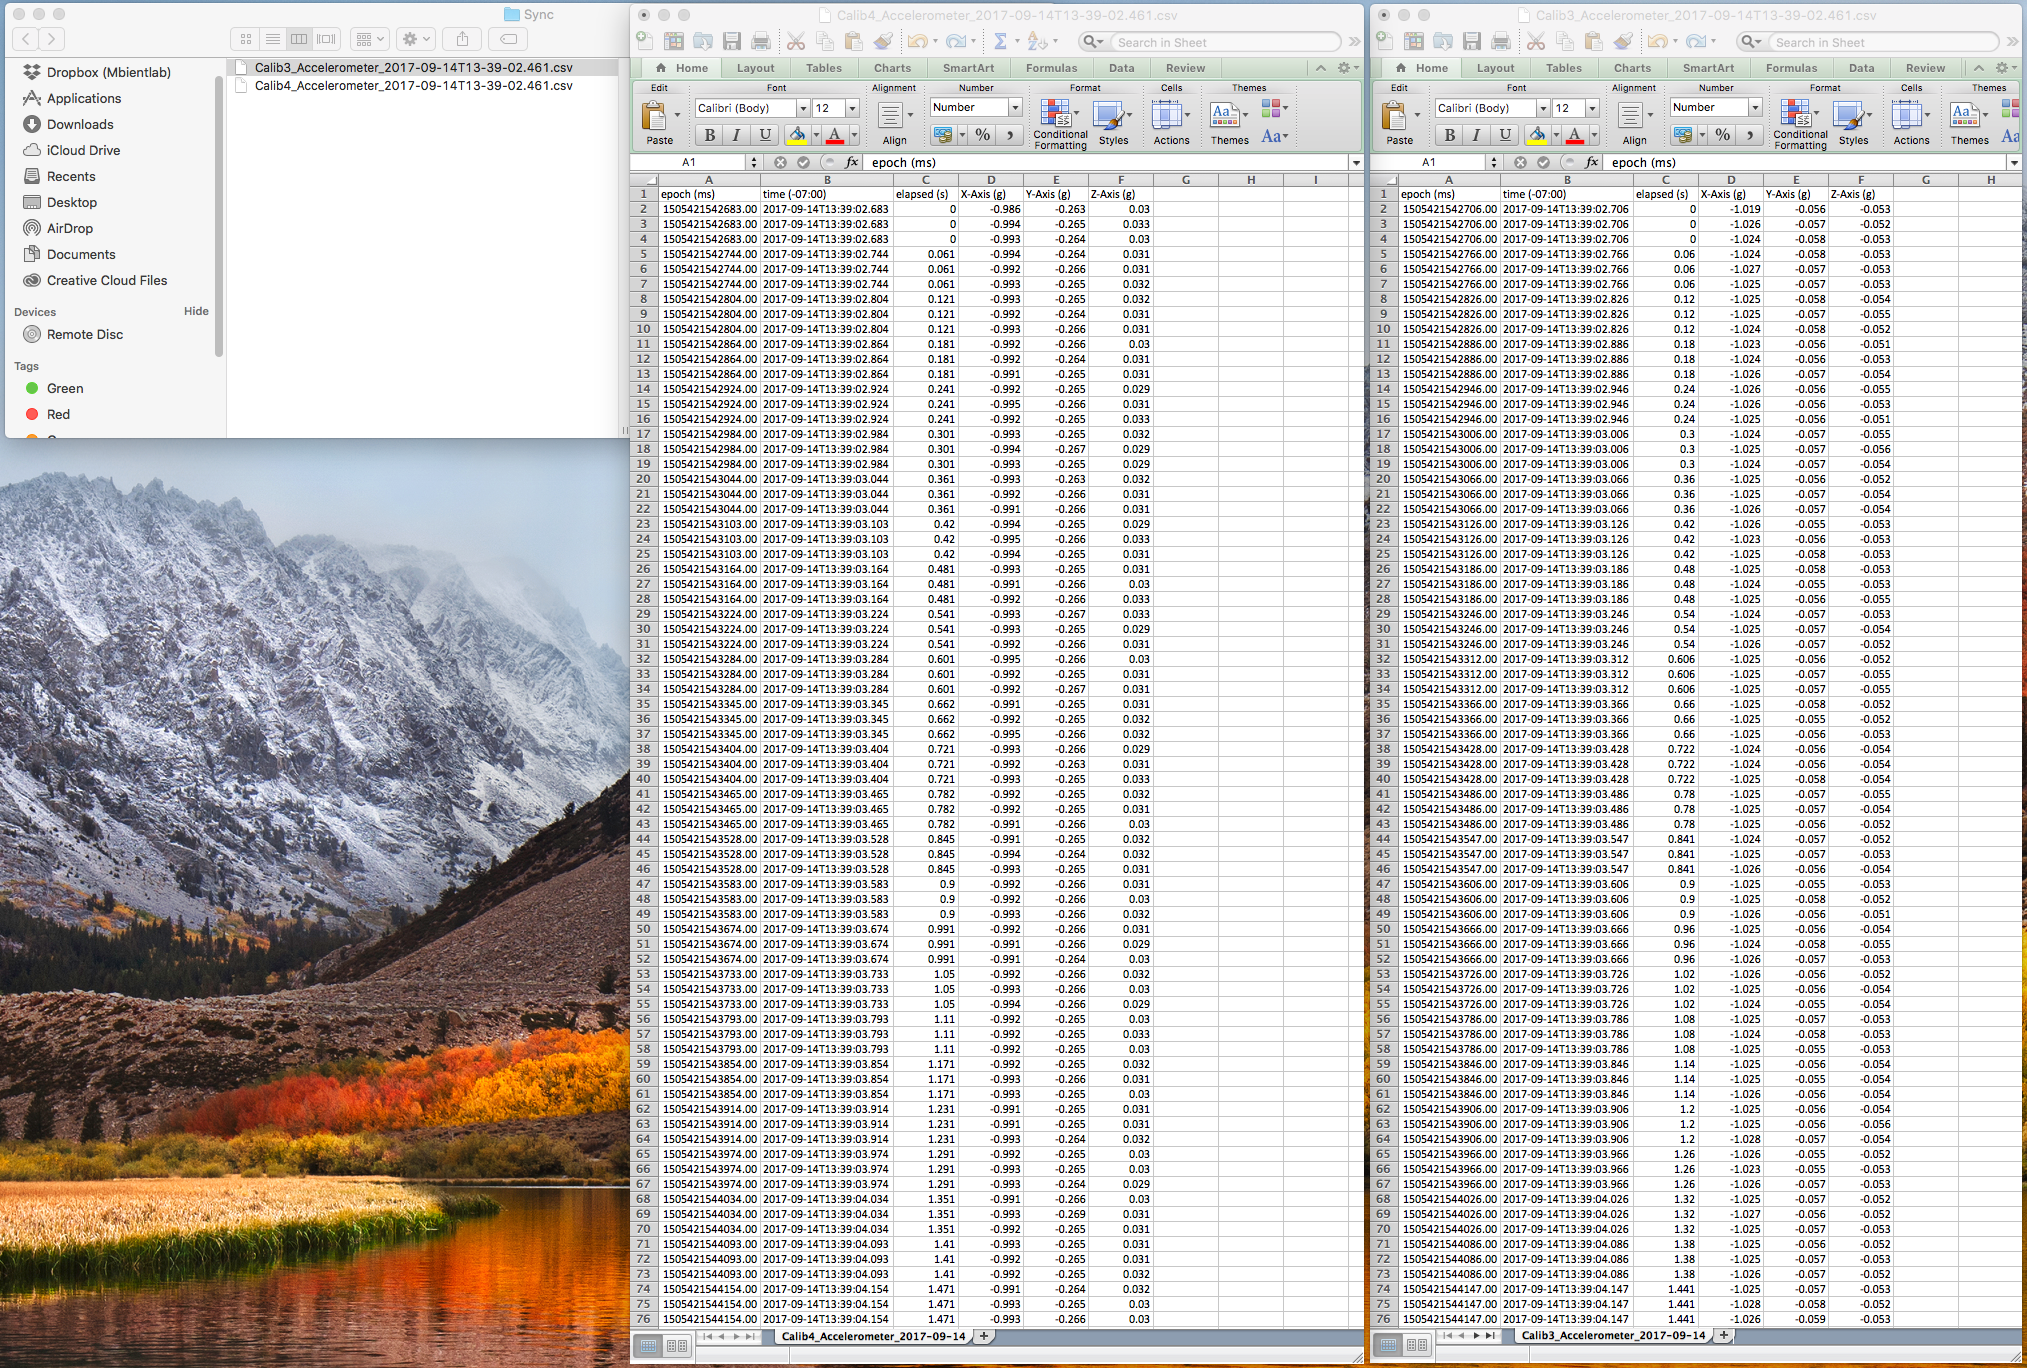
As you can see in Excel; there are three timestamps followed by accelerometer x,y,z data.
epoch (ms) |
time (-07:00) |
elapsed (s) |
X-Axis (g) |
Y-Axis (g) |
Z-Axis (g) |
|---|---|---|---|---|---|
Unix time in ms |
Full Date |
Elapsed Time |
Acc X |
Acc Y |
Acc Z |
1505421542683.00 |
2017-09-14T13:39:02.683 |
0 |
-0.986 |
-0.263 |
0.03 |
Note
You might need to format the Epoch cell in Excel to see the timestamp correctly.
The Unix Epoch (or Unix time or POSIX time or Unix timestamp) is the number of seconds that have elapsed since January 1, 1970 (midnight UTC/GMT)
For example, epoch time 1521250282.00 is 1521250282 seconds since Jan 01 1970. (UTC) which translates to 03/17/2018 @ 1:31am (UTC)
You should look at the epoch portion of the timestamp for synching purposes.
What you are looking for is to match the two timestamps that are closest to one another (hopefully only a few ms apart) between the two files. Then delete any extraneous data sets.
The first MetaSensors has an initial timestamp of 1505421542706.00 and the second starts at 1505421542683.00, this is only a difference of .023 seconds! This is fine for our application as this difference in time is beyond perceptible to the human eye and more than acceptable for medical and consumer applications.
If you started recording data from the first sensor seconds, minutes, or even hours before the other sensor, that’s ok! Just delete the extra data (row entries) in Excel that you do not need. The idea is to find the two best matching and closest timestamps between the two sensors to sync their data sets.
You will want to combine the two files into one file when you are ready:
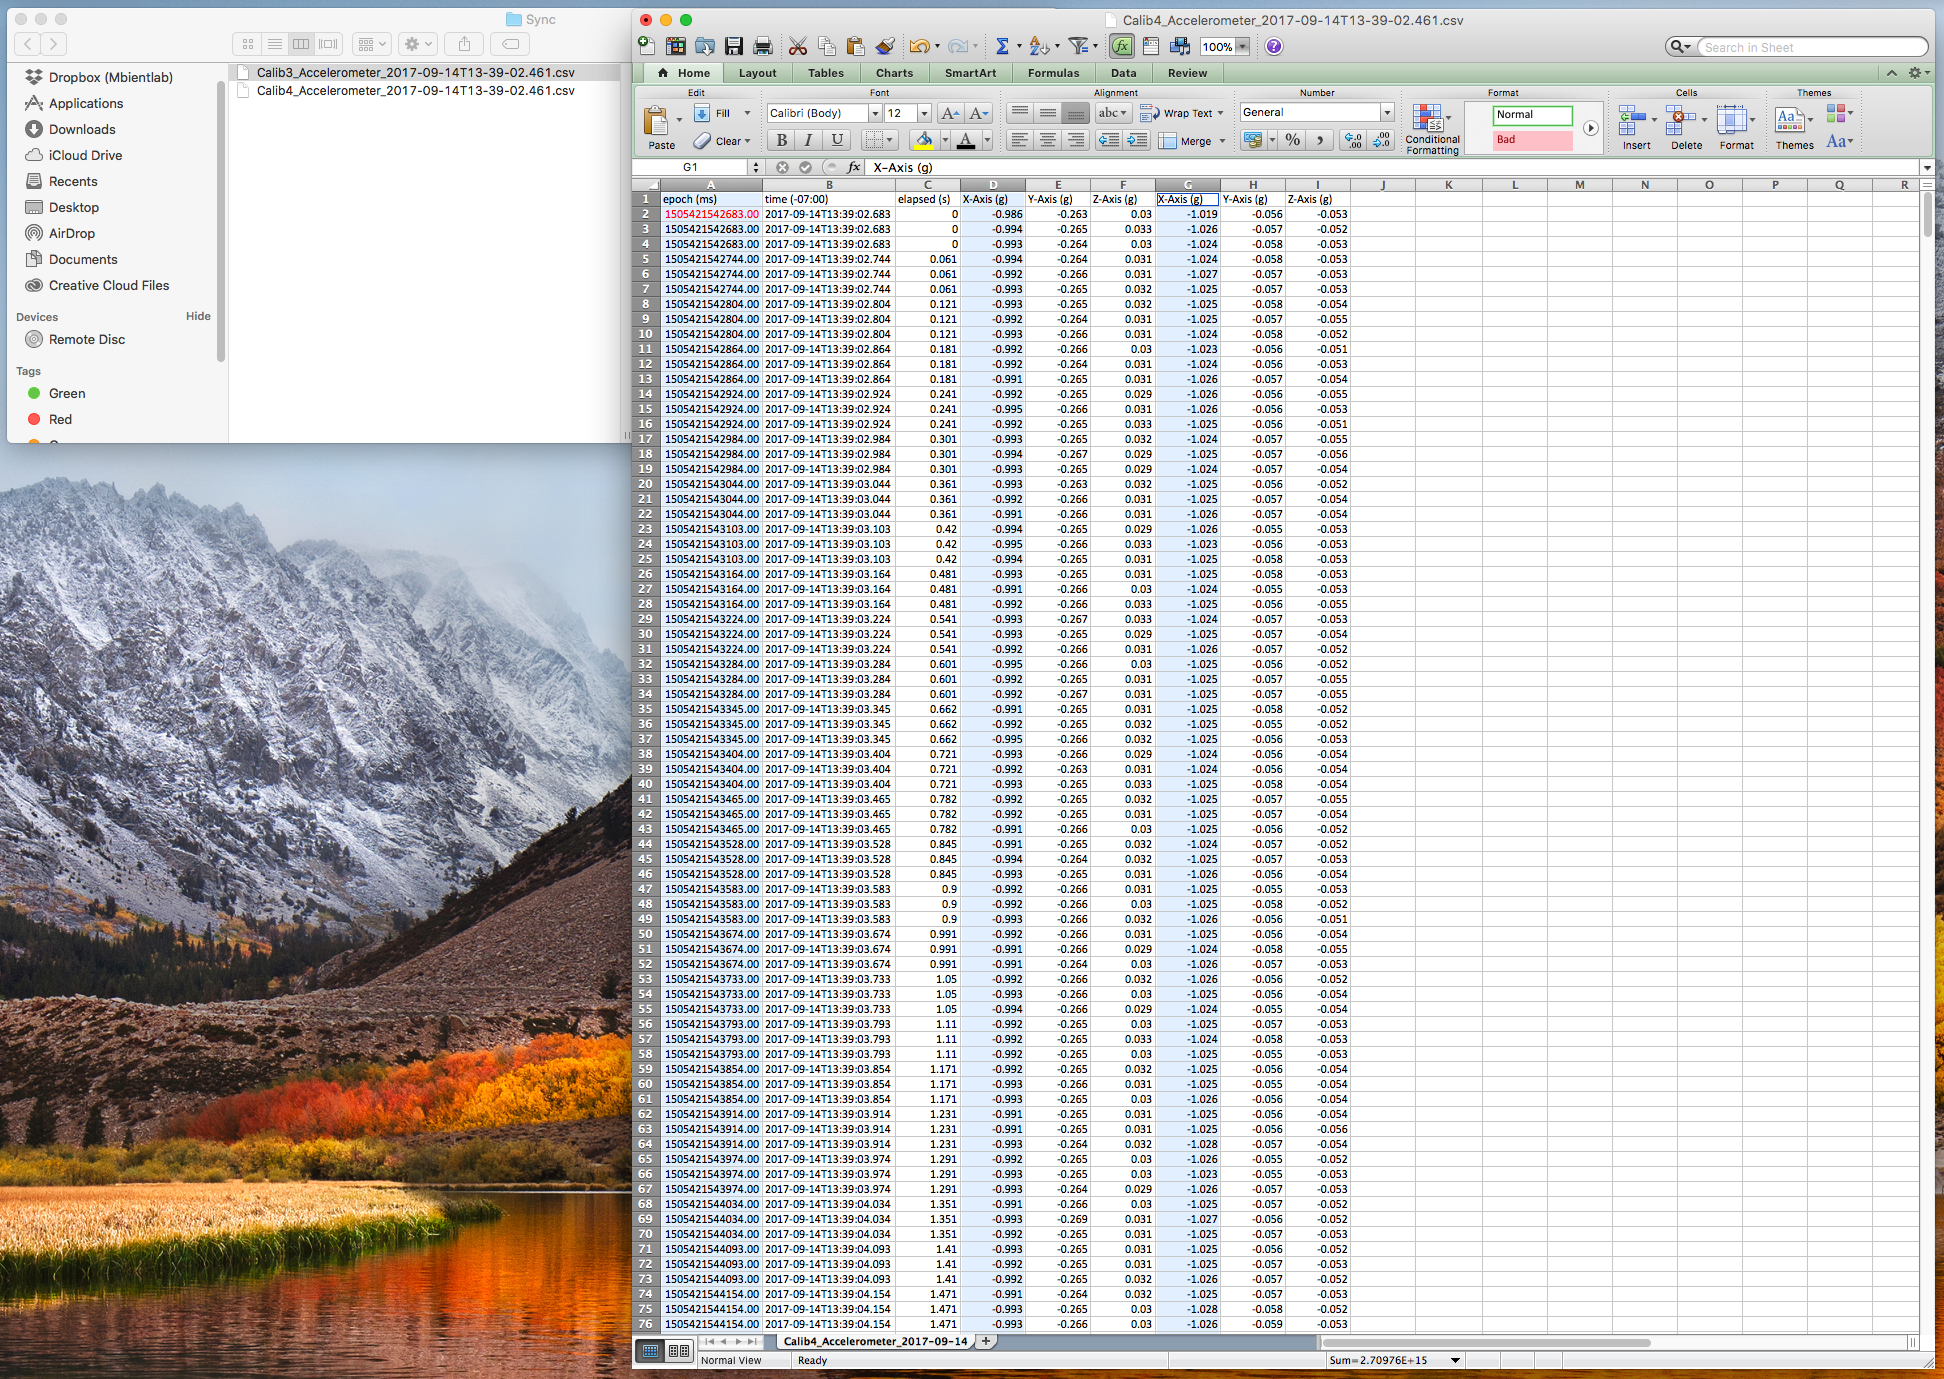
And finally, delete the extra timestamps (Excel rows / data entries) from the second sensor once you have decided on your best timestamp match.
You can then graph the data easily as we have done below:
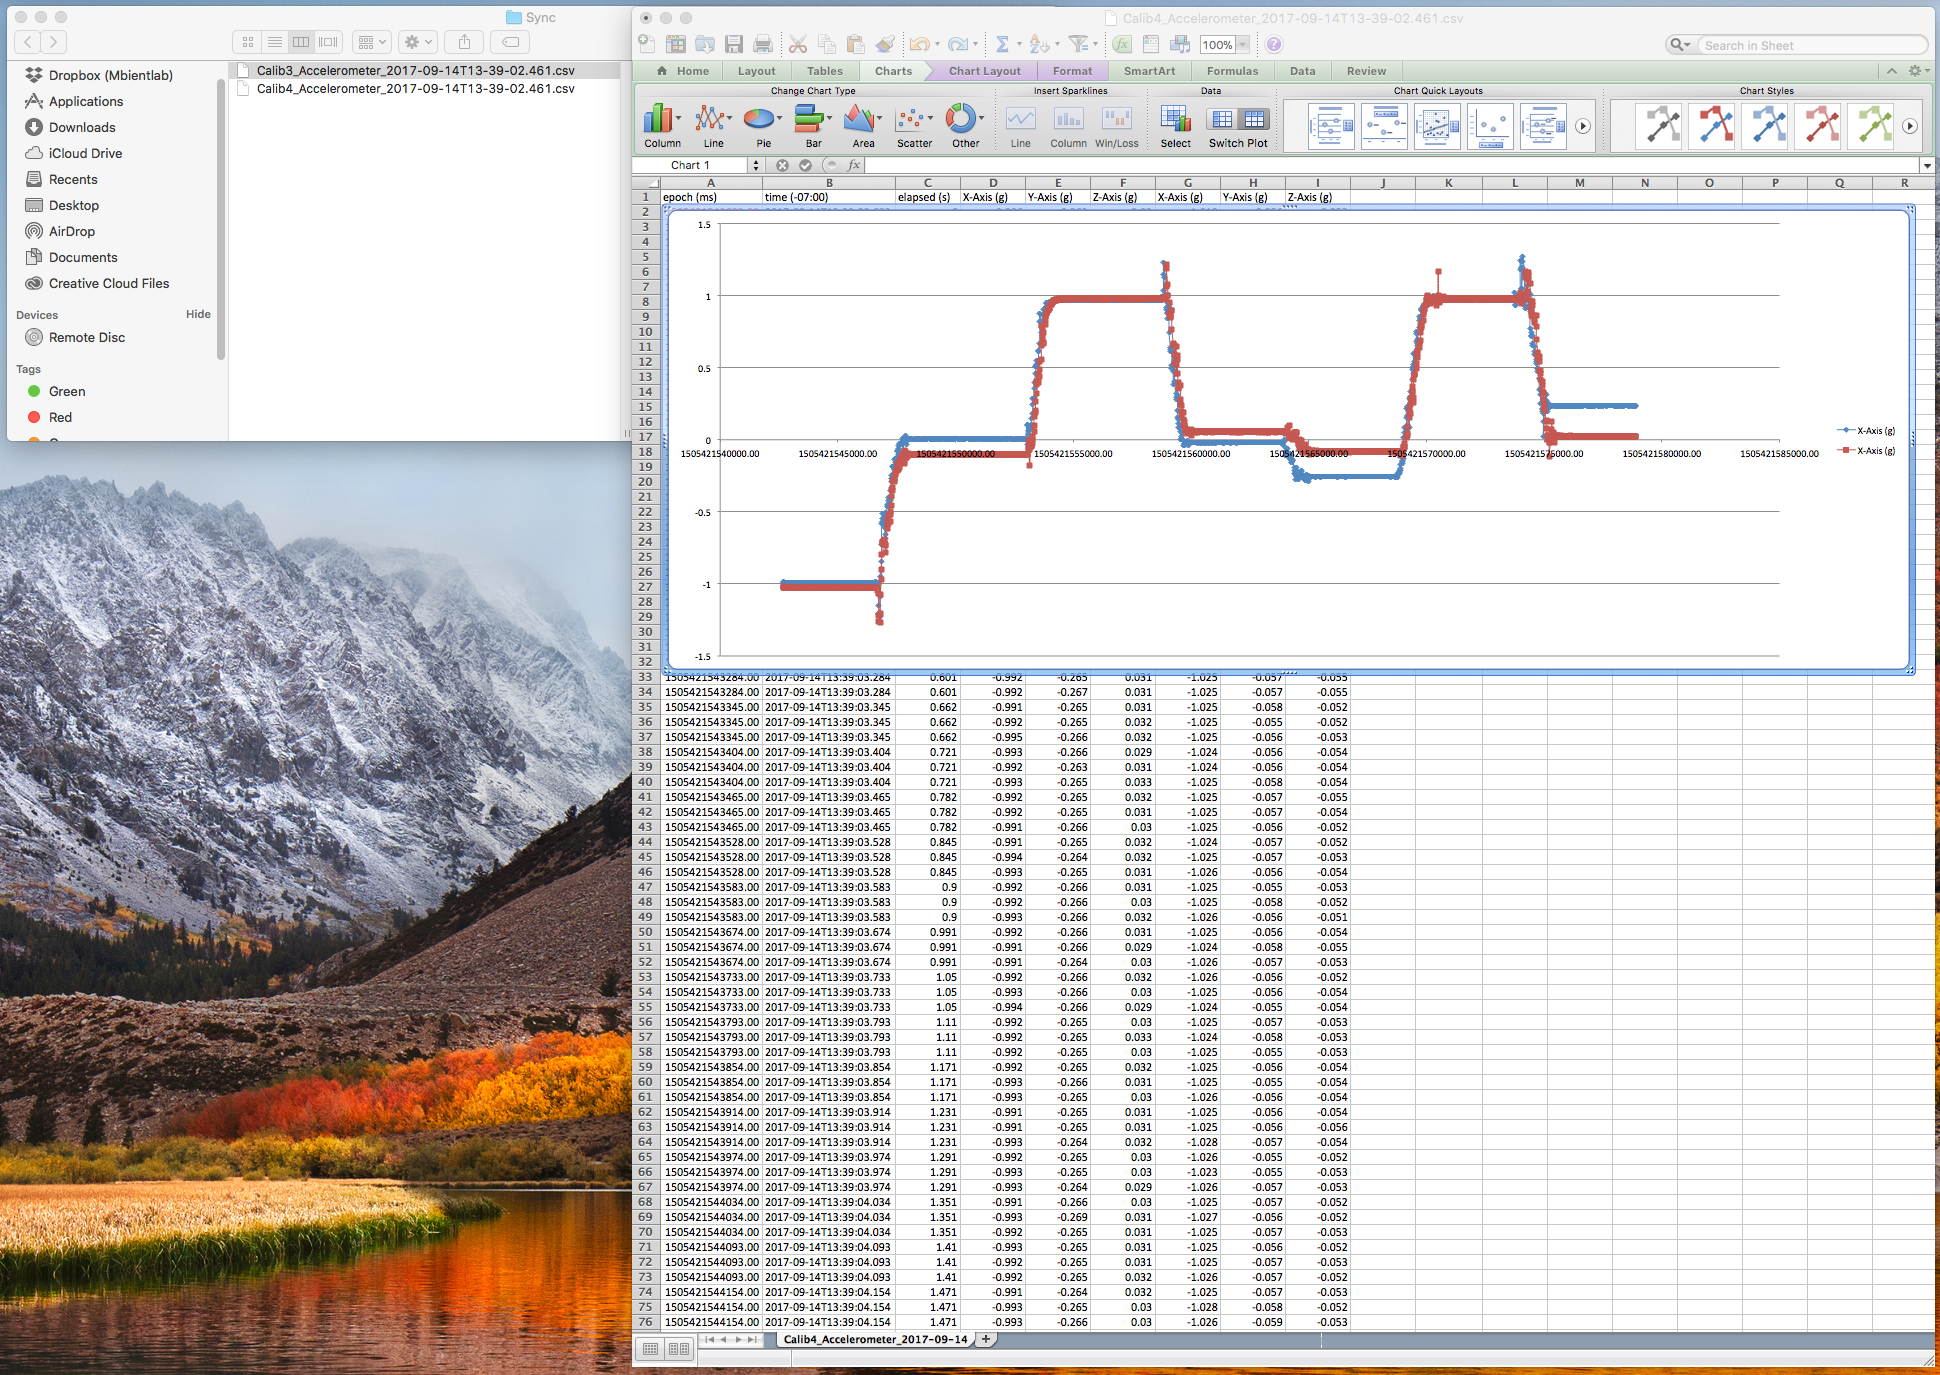
We are done!
Warning
You should note that some entries have repeat timestamps. This is normal. We pack data in order to maximize efficiency of the device.
You can do a bit of math to restore timestamps for packed data as we have done below:
epoch (ms) |
time (-07:00) |
elapsed (s) |
X-Axis (g) |
Y-Axis (g) |
Z-Axis (g) |
|---|---|---|---|---|---|
1505421542683.00 |
2017-09-14T13:39:02.683 |
0 |
-0.986 |
-0.263 |
0.03 |
1505421542703.00 |
2017-09-14T13:39:02.703 |
0.020 |
-0.994 |
-0.265 |
0.033 |
1505421542723.00 |
2017-09-14T13:39:02.723 |
0.040 |
-0.993 |
-0.264 |
0.03 |
1505421542744.00 |
2017-09-14T13:39:02.744 |
0.061 |
-0.994 |
-0.264 |
0.031 |
1505421542764.00 |
2017-09-14T13:39:02.764 |
0.081 |
-0.992 |
-0.266 |
0.031 |
1505421542784.00 |
2017-09-14T13:39:02.784 |
0.101 |
-0.993 |
-0.265 |
0.032 |
1505421542804.00 |
2017-09-14T13:39:02.804 |
0.121 |
-0.993 |
-0.265 |
0.032 |
Synchronizing Multiple Datasets in Python
We can accomplish synching multiple data sets easily using Python. Here is a basic example of how to do this synchronization using the Pandas Python package:
First we import the pandas package and read in the data:
import pandas as pd

df = pd.read_csv("Test_Accelerometer.csv") #Reading the dataset in a dataframe using Pandas
df2 = pd.read_csv("Test_Gyroscope.csv") #Reading the dataset in a dataframe using Pandas
In this case, we are trying to synchronize 100Hz gyroscope data to 50Hz accelerometer data. The head command can be used to check if the data was imported correctly.
df.head(5) #This will display the first 5 lines of the imported data set
df2.head(5)
We are looking to merge the gyroscope data with the accelerometer data by finding the “closest” timestamp in the gyro data set that matches a given timestamp in the accelerometer data set.
Lets take an easy example to illustrate what we want to accomplish.
>>> Data set 1:
>>>
>>> Time: 12:45pm Data: 0.1
>>>
>>> Data set 2:
>>> Time: 12:40pm Data: 2
>>> Time: 12:46pm Data: 1
>>> Time: 12:48pm Data: 3
In this case, we are looking to merge the data sets to form 1 set as such:
>>> Combined data set:
>>> Time 12:45pm Data1: 0.1 Data2: 1
Fortunately, there is a very easy function in the Pandas library that lets us do this:
pd.merge_asof(df, df2, on='epoch (ms)')
This will merge df2 with df, while using the ‘epoch (ms)’ column as the “index” to merge on. In this case, we will get a merged data set with x, y, and z axis data for both the accelerometer and the gyroscope.