10. MetaCloud
Please note MetaCloud is entirely optional.
MetaCloud is the MbientLab cloud platform used for raw sensor data storage.
MetaCloud is available as a monthly subcription and works only with MetaSensors.
In this tutorial we will look at how to create an account, upload and retrieve sensor data.
10.1. Pricing
MetaCloud uses Stripe to process payment and accepts all major credit cards.
- $5/month for 1 MetaSensor (unlimited data)
- $10/month for 5 MetaSensors (unlimited data)
- $15/month for 15 MetaSensors (unlimited data)
Cancel anytime. No contracts. No hidden fees. You own all of your data.
10.2. Subscription
To create an account, follow the steps:
- Navigate to the cloud login page.
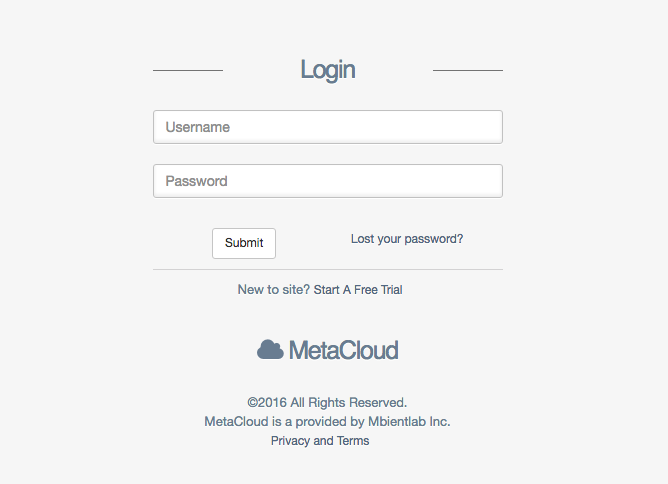
Select “Start a Free Trial”
You will put in your credit card but you will not be charged until your free trial has passed. The free trial lasts 3 days.
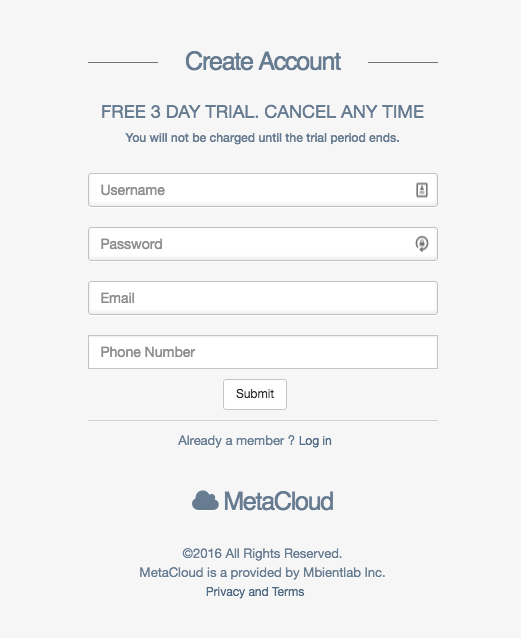
Create a username and password
Verify your email
Once your account has been created, verify your email address. Go to your inbox and make sure to acknowledge your new MetaCloud account. If you didn’t receive an email, check your spam/trash folder. Once your email is verified, simply login again.
Log in
You will automatically be directed to the “Profile” page in order to select a MetaCloud subscription tier.
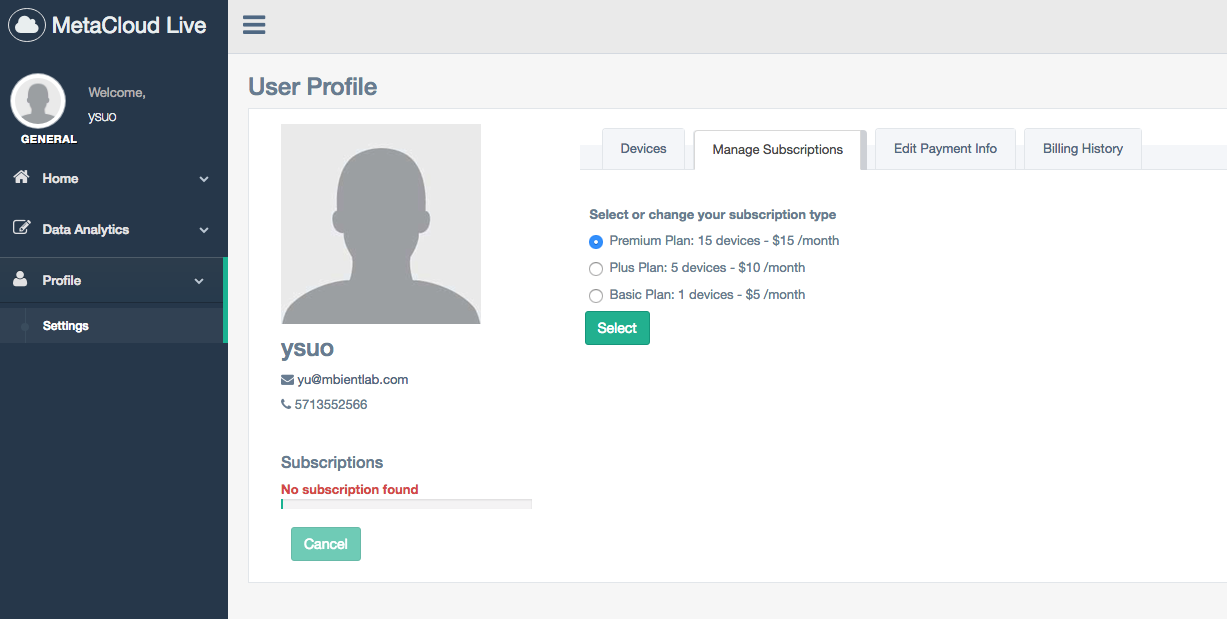
- Select a subscription and input payment information
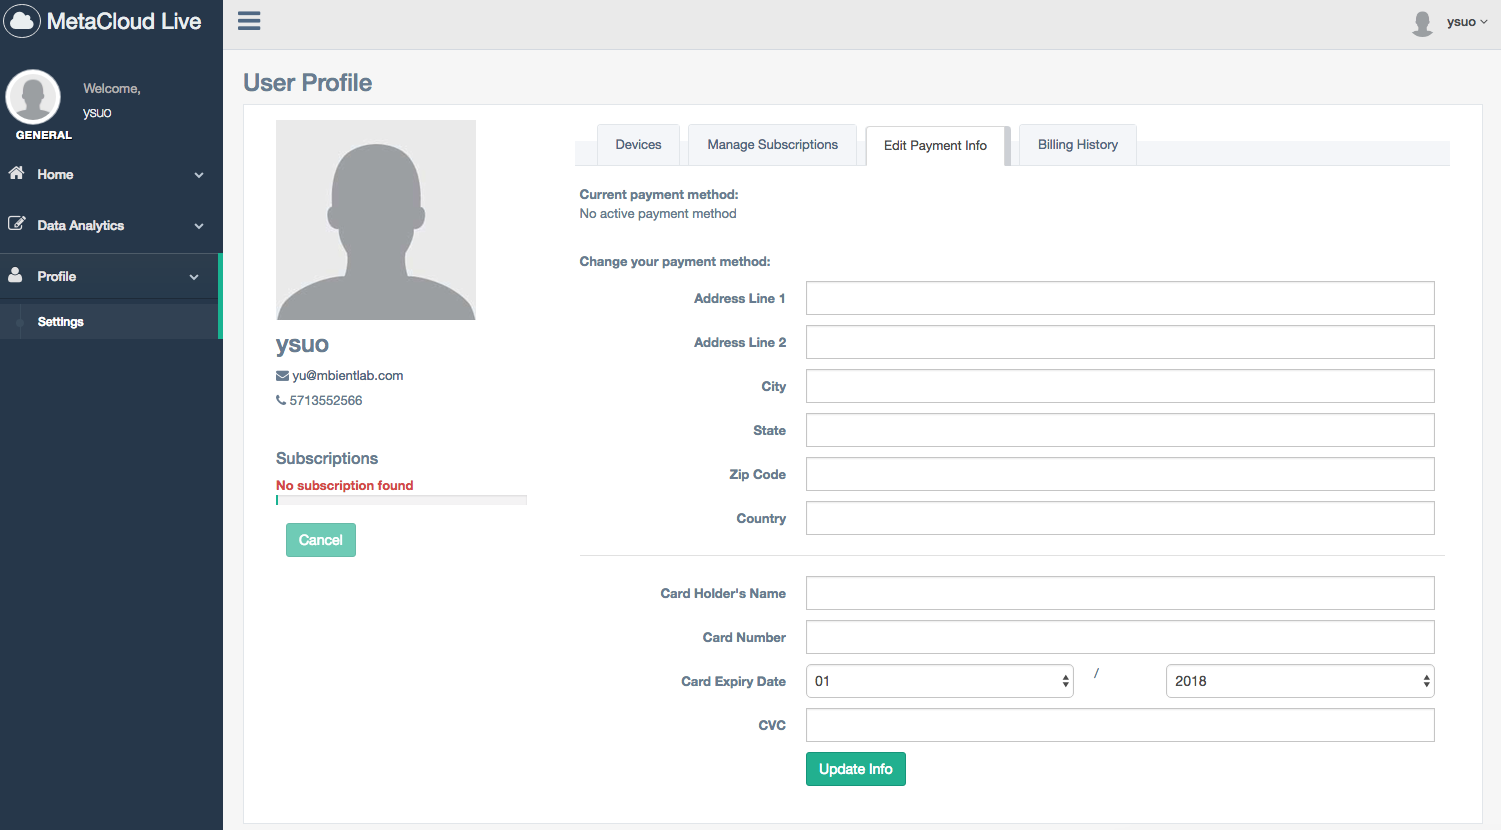
Select your desired payment plan and input your credit card information. All subscriptions start with a 3 day FREE trial. You will not be charged for the first 3 days of your MetaCloud subscription.
Please note you will be billed monthly and you can cancel at any time.
You will receive a notification of a successful payment. You can check your current subscription status on the subscription page at anytime.
10.3. Cancellation
You can cancel your subscription at any time by login in to your account and navigating to the “Profile” page.
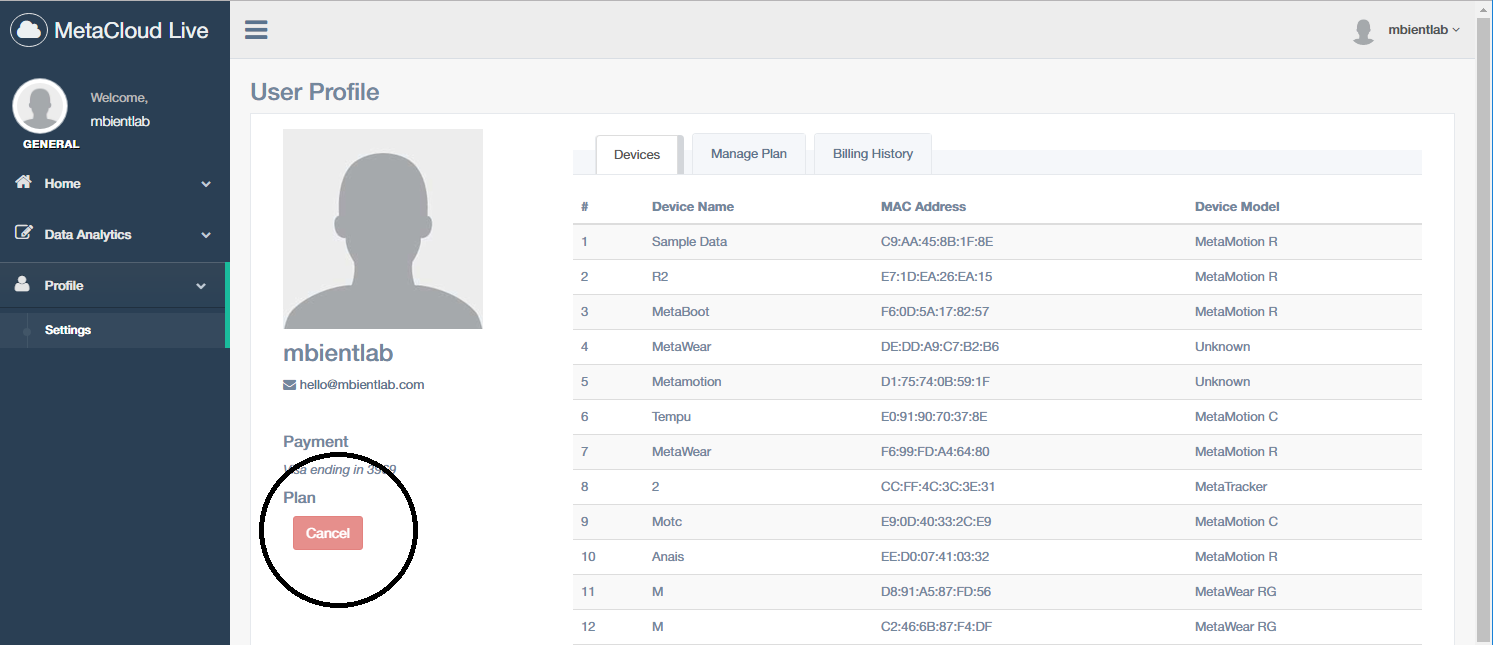
You will get a pop-up confirming your cancellation.
10.4. Data Storage
To upload data to MetaCloud, you must use the MetaBase app.
You can view your raw data on the “Explorer” page on the “Home” tab.

There is a delete and download button for each data set and session. The data is available in CSV format.
Please note that your devices and data are automatically managed by the cloud; you don’t need to change, upload or update any of the sensor data or information manually.
10.5. Data Visualization
There are two sections on your MetaCloud Dashboard, your Main page “Home” and the “Data Analytics” section.
The “Dashboard” page on your “Home” tab is where all your data can be visualized.
There is a data picker for which you can select data by date, device mac, or session name:

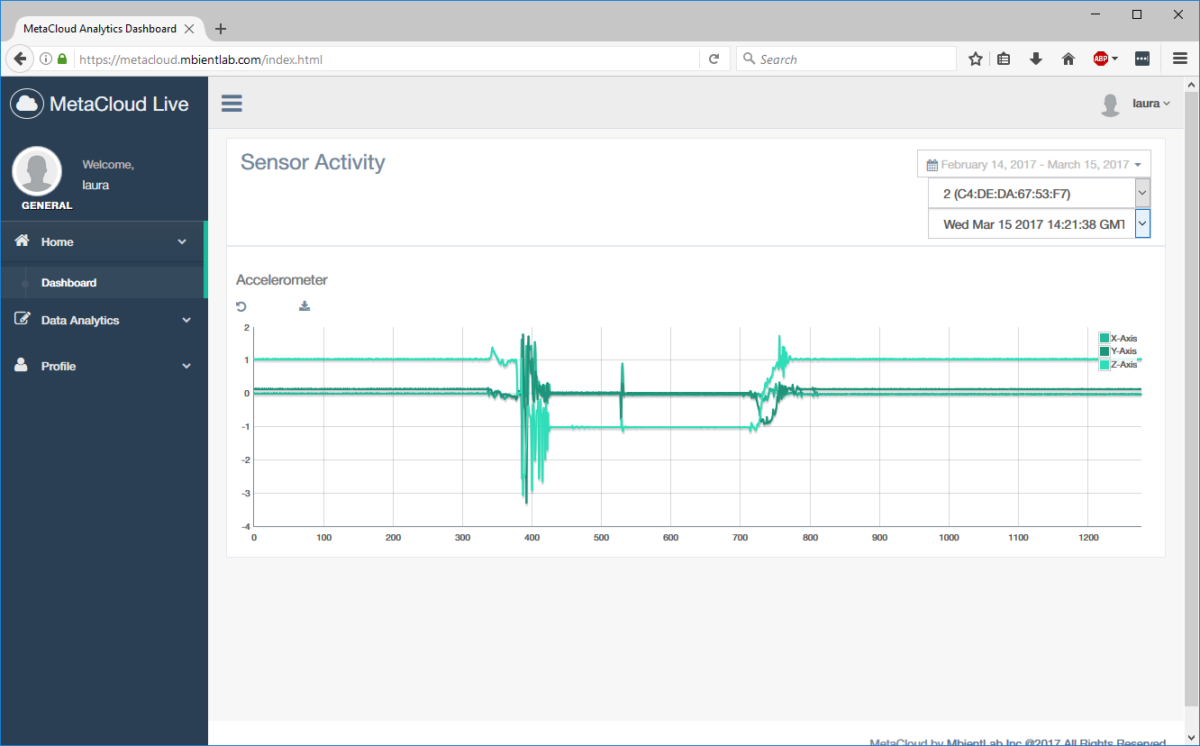
If there are multiple sensors for that data session, each type of sensor data will show up in a separate graph.
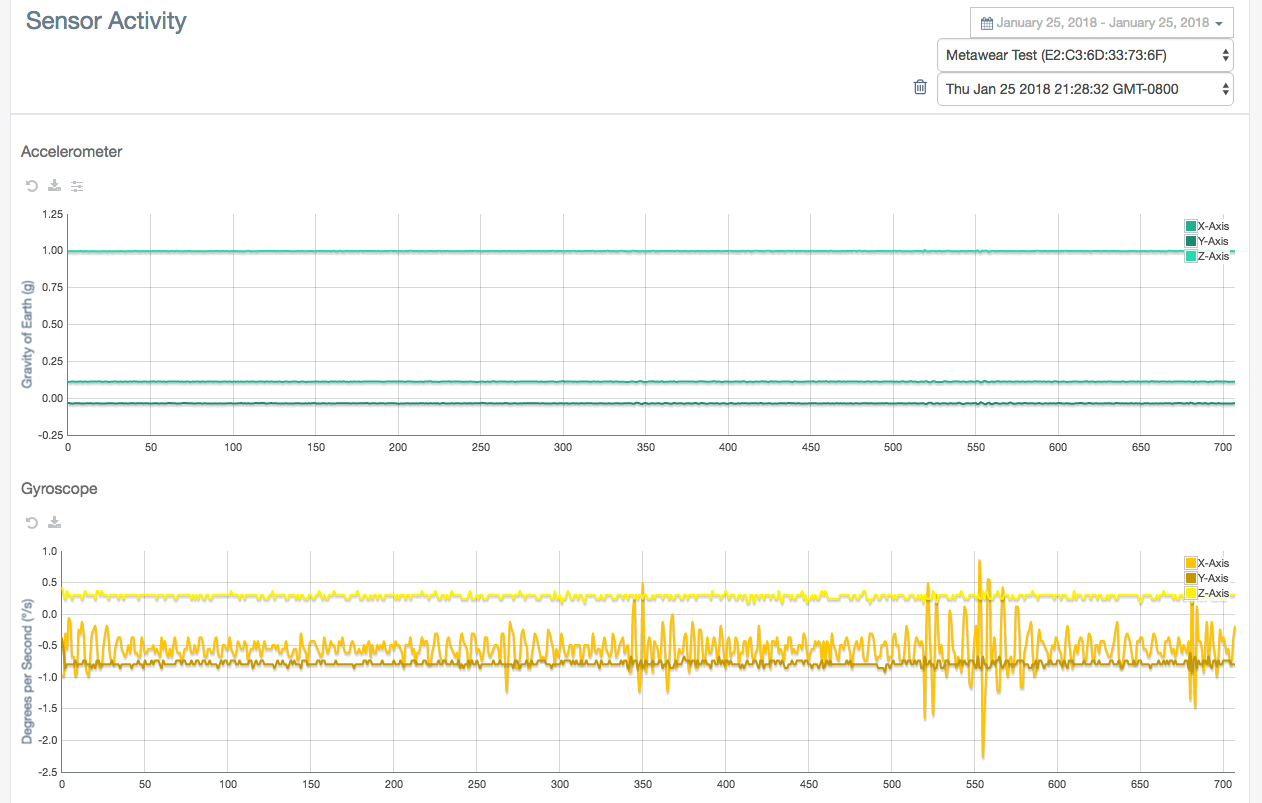
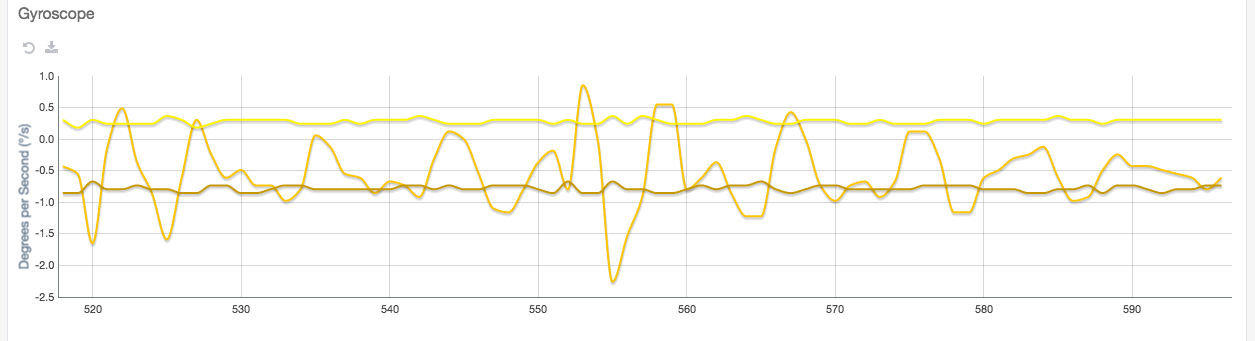
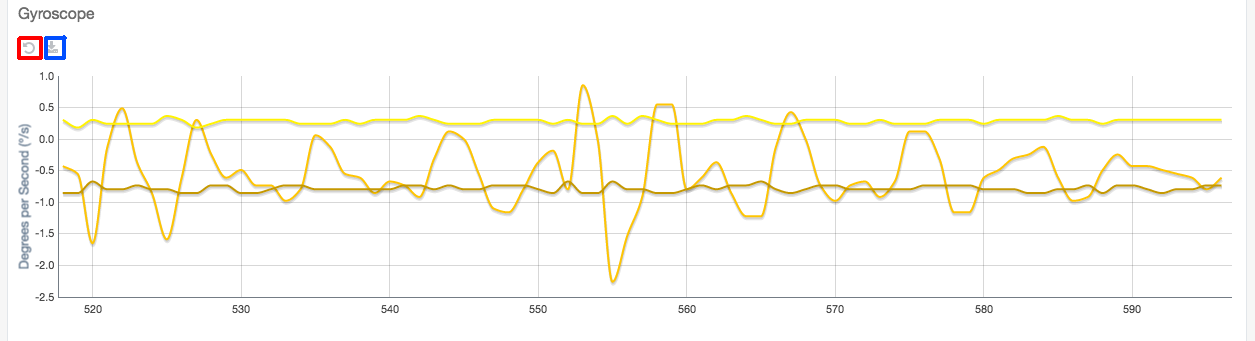
You can select any portion of the graphs to zoom in on that section. This is useful for exploring areas where data is dense.
Press the reset button at the top of each graph to restore the graph to its original zoom factor (highlighted in red below).
Press the download button on top of each graph to download the data for that sensor in the data session (highlighted in blue below).
10.6. Data Analysis
The “Data Filtering” page on your “Data Analytics” tab is where all your data can be filtered and analyzed.
Once data has been selected, it will be graphed on your screen automatically. By default the latest data set is always graphed on the main page.
You are free to zoom and refresh the graphs. Select any filter you want to apply to the data. Currently, we allow stacking of up to 2 filters at the same time. This is very useful for doing a very quick visual inspection of the data.
In the example below, we combine 2 filters to quickly analyze walking data using the accelerometer:
- First we apply a “low pass” filter. This removes a lot of the random noise that is common in raw accelerometer data.
- Then we apply a “root mean square” filter. This lets us look at the magnitude (or total acceleration in all directions), which gives us a very crude estimate of how fast we were moving.
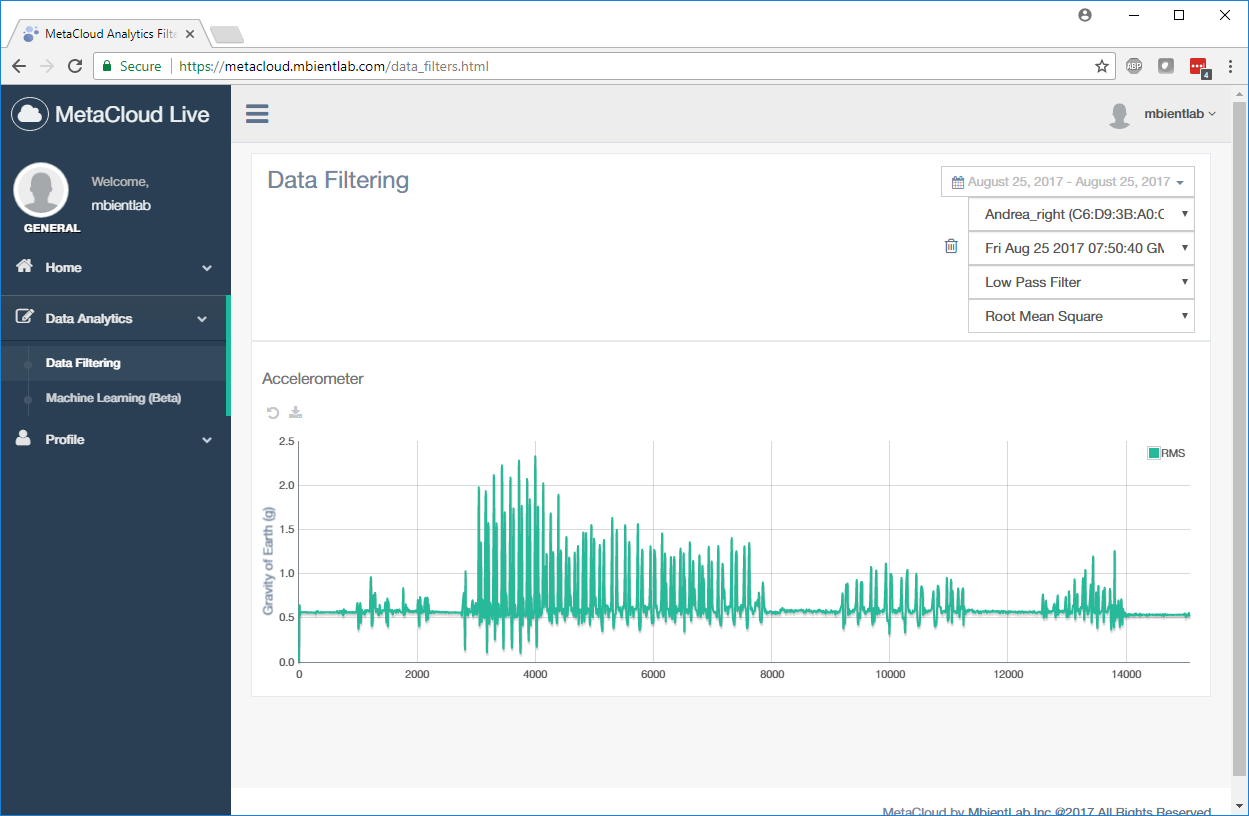
From the filtered graph, we can quickly identify the areas where there was significant movement and how large/fast those movements were.